Analyzing a USDJPY Short Setup with the CLS Strategy
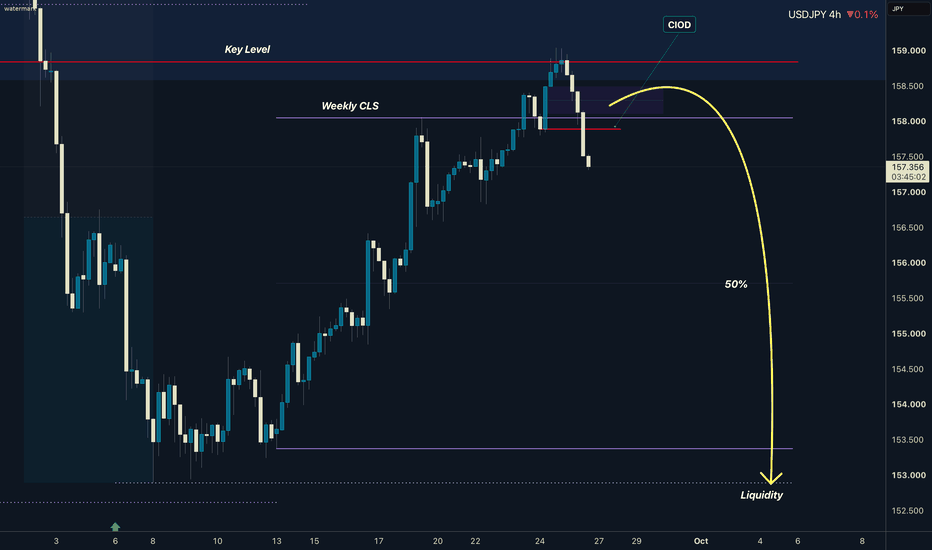
Anatomy of a High-Probability Trade Idea
Professional trading isn't about guesswork; it's about identifying repeatable patterns and executing with precision. A recent chart shared by David Perk for USDJPY offers a perfect case study in how a structured approach, like the CLS strategy, helps a trader build a logical thesis for a potential trade.
This idea focuses on a bearish (short) setup on the 4-hour timeframe. It's not just a random call to sell. Instead, it's based on a sequence of market events that, when combined, point to a potential shift in power from buyers to sellers. Let's break down the components of this analysis.
The Foundation: The Weekly CLS Range
The first element mentioned is the creation of a "New CLS Range." In our methodology, a range is more than just a sideways market. It represents a period of balance where large institutions may be accumulating or distributing positions. The boundaries of this range—the high and the low—are critical reference points where liquidity rests.
On the USDJPY chart, the identification of this new range sets the stage for the entire trade idea. Everything that follows is interpreted in relation to this structure. A solid forex education begins with understanding market structure, and identifying these key ranges is a fundamental skill.
The Logic Behind the Bearish Bias
The idea doesn't simply say, "sell at the top of the range." It outlines a specific sequence of events that must occur:
Manipulation into the Key Level: The chart highlights a move above the established CLS range. This isn't seen as a bullish breakout. Instead, it's interpreted as a "manipulation" or a liquidity grab. This move is designed to trigger stop-loss orders from early sellers and lure in breakout buyers, providing liquidity for larger players to enter short positions at favorable prices.
Reaction and Break Below: After the manipulation, price fails to continue higher and instead moves back down, breaking below the CLS range. This is the first sign that the upward thrust was false and that sellers are beginning to assert control.
Confirmation via CIOD: This is the most crucial part. The analysis calls for waiting for a "CIOD" (Change in Order Flow). This is a specific structural shift on a lower timeframe that confirms sellers have absorbed the buying pressure and are now in command. It’s the final green light that signals the potential start of an "expansion" phase to the downside.
Defining the Trade Parameters
A professional trade idea is incomplete without clear parameters for entry, exit, and risk management.
- Entry: The instructions are explicit: "Stay patient and enter only after candle close." This prevents entering prematurely on a volatile wick and waits for the market to show commitment to the move.
- Target: The target is set at "50% of the CLS range." This is a logical, objective target based on the established market structure, removing greed and emotion from the decision-making process.
This entire framework—from identifying the range to waiting for confirmation and setting logical targets—is a repeatable process. It's this kind of systematic thinking that is taught within a structured trading academy, moving a trader from inconsistent results to a disciplined methodology.
WRITTEN BY
David Perk
Full-time forex trader and mentor. $1M+ verified track record on FX Blue. Teaches the CLS strategy to funded traders — live, five times a week.
Want to trade this alongside David?
Join the community — livestreams 5× a week, trade breakdowns, and entries called in real time. Your first week is free, full access to every paid feature.
Join the community — first week freeNo experience needed. Cancel anytime.